The Average Investor's Blog

A software developer view on the markets

Archive for the ‘Strategies’ Category

More orthodox ARMA/GARCH trading

Posted by The Average Investor on Dec 15, 2011

The system described in the earlier series for ARMA trading was in fact an “extreme” version of the more common, orthodox approach prevailing in the literature. Recently I tried using R to reproduce the results of a particular paper, and that lead to a lot of new developments …

How is typically ARMA trading simulated? The data is split into two sets. The first set is used for model estimation, an in-sample testing. Once the model parameters are determined, the model performance is tested and evaluated using the second set, the out-of-sample forecasting. The first set is usually a few times larger than the second and spans four or more years of data (1000+ trading days).

I wanted to be able to repeat the first step once in a while (weekly, monthly, etc) and to use the determined parameters for forecasts until the next calibration. Now, it’s easier to see why I classified my earlier approach as an “extreme” – it does the model re-evaluation on a daily basis. In any case, I wanted to build a framework to test the more orthodox approach.

To test such an approach, I needed to perform а “rolling” forecast (have mercy if that’s not the right term). Let’s assume we use weekly model calibration. Each Friday (or whatever the last day of the week is) we find the best model according to some criteria. At this point we can forecast one day ahead entirely based on previous data. Once the data for Monday arrives, we can forecast Tuesday, again entirely based on previous data, etc.

My problem was that the package I am using, fGarch, doesn’t support rolling forecasts. So before attempting to implement this functionality, I decided to look around for other packages (thanks god I didn’t jump to coding).

At first, my search led me to the forecast package. I was encouraged – it has exactly the forecast function I needed (in fact, it helped me figure out exactly what I need;)). The only problem – it supports only mean models, ARFIMA, no GARCH.

Next I found the gem – the rugarch package. Not only it implements a few different GARCH models, but it also supports ARFIMA mean models! I found the documentation and examples quite easy to follow too, not to mention that there is an additional introduction. All in all – a superb job!

Needless to say this finding left me feeling like a fat kid in a candy store (R is simply amazing in this regard!). Most likely you will be hearing about mew tests soon, meanwhile let’s finish the post with a short illustration of the rugarch package (single in-sample model training with out-of-sample forecast):

library(quantmod)
library(rugarch)

getSymbols("SPY", from="1900-01-01")
spyRets = na.trim( ROC( Cl( SPY ) ) )

# Train over 2000-2004, forecast 2005
ss = spyRets["2000/2005"]
outOfSample = NROW(ss["2005"])

spec = ugarchspec(
            variance.model=list(garchOrder=c(1,1)),
            mean.model=list(armaOrder=c(4,5), include.mean=T),
            distribution.model="sged")
fit = ugarchfit(spec=spec, data=ss, out.sample=outOfSample)
fore = ugarchforecast(fit, n.ahead=1, n.roll=outOfSample)

# Build some sort of indicator base on the forecasts
ind = xts(head(as.array(fore)[,2,],-1), order.by=index(ss["2005"]))
ind = ifelse(ind < 0, -1, 1)

# Compute the performance
mm = merge( ss["2005"], ind, all=F )
tail(cumprod(mm[,1]*mm[,2]+1))

# Output (last line): 2005-12-30  1.129232

Hats down to brilliancy!
Posted in R, Strategies | Tagged: , , , | 12 Comments »

Pre-computing a trading plan in parallel

Posted by The Average Investor on Nov 11, 2011

R version 2.14 introduced a new package, called parallel. This new package combines the functionality from two previous packages: snow and multicore. Since I was using multicore to parallelise my computations, I had to migrate to the new package and decided to publish some code.

Often trading strategies are tested using the daily closing price both to determine the position and to perform the trading. Since we need to pre-compute an action plan, parallelisation may be necessary if the computations are heavy.

The code at the end of this post is pre-computing the actions for the CSS Analytics’ DVI indicator. The entry point in the code is as follows:

library( quantmod )
library( parallel )

# Load the code at the end of this post

# Get the SPY ETF from Yahoo
getSymbols( "SPY", from="1900-01-01" )

# Compute the actions
computeDVIActionPar( Cl( SPY ), range=10, cores=8 )

This basically requests to compute the position for all possible closing prices between -10% and +10%, parallelising the work 8 fold. The output of the command is something like:

   Price    Pct Position
1 111.59 -10.00        1
2 127.97   3.21       -1
3 136.38  10.00       -1

This output tells us that if the SPY doesn’t advance more than 3.21%, closing above $127.97, we should establish a long position at the close, otherwise – short. With that knowledge, and depending on the current position, what is left to do is to go to our Interactice Broker account and to put a limit on-close order. The complete code for the missing functions follows.

computeOneDVIAction = function( close, x )
{
   x[tail( index( x ), 1 )] = close
   dvi = DVI( x )
   val = as.numeric( tail( dvi$dvi, 1 ) )

   # Short if DVI > 0.5, long otherwise
   if( is.na( val ) )
   {
      return( 0 )
   }
   else if( val > 0.5 )
   {
      return( -1 )
   }

   return( 1 )
}

computeDVIActionPar = function( x, step=0.01, range=5, cores )
{
   require( quantmod, quietly=TRUE )
   require( parallel, quietly=TRUE )

   prices = c( )
   positions = c( )

   latestClose = as.numeric( coredata( last( x ) ) )

   # Shift to the left to use the last entry as the "guessed" close
   yy = lag( x, -1 )

   # range is percentages
   range = range / 100

   # Compute the vector with all closing prices within the range
   close = latestClose * ( 1 - range )
   lastClose = latestClose * ( 1 + range )

   close = round( close / step ) * step
   numSteps = ( close - latestClose ) / step + 1

   close = round( close, 2 )
   lastClose = ceiling( lastClose * 100 ) / 100

   closes = close

   repeat
   { 
      if( close >= lastClose ) break

      close = round( latestClose + step*numSteps, 2 )

      numSteps = numSteps + 1

      closes = c( closes, close )
   }

   # Detect the cores if not supplied
   if( missing( cores ) )
   {
      cores = parallel:::detectCores()
   }

   res = mclapply( closes,
                   computeOneDVIAction,
                   x = yy,
                   mc.cores = cores )

   # Summarize the positions
   prices = c()
   pcts = c()
   positions = c()

   # Impossible position
   lastPosition = -1e9

   len = length( closes )
   for( ii in 1:(len - 1) )
   {
      if( res[[ii]] != lastPosition )
      {
         positions = append( positions, res[[ii]] )
         prices = append( prices, closes[ii] )
         pcts = append( pcts, round( ( closes[ii] - latestClose ) /
                                     latestClose * 100, 2 ) )
         lastPosition = res[[ii]]
      }
   }

   positions = append( positions, res[[len]] )
   prices = append( prices, closes[ii] )
   pcts = append( pcts, round( ( closes[len] - latestClose ) /
                               latestClose * 100, 2 ) )

   df = data.frame( prices, pcts, positions )
   colnames( df ) = c( "Price", "Pct", "Position" )
   return( df )
}

Posted in R, Strategies | 5 Comments »

Covered Call ETF Performance

Posted by The Average Investor on Nov 1, 2011

Covered call ETFs have become quite popular lately. Living in Canada, I have been holding a couple Canadian members of this family for the last few months. When I purchased them, I liked the benefits and since I wasn’t expecting any bull markets on the horizon, I bought some. These were new products back them, so I promised myself to do some more detailed analysis at a later point.

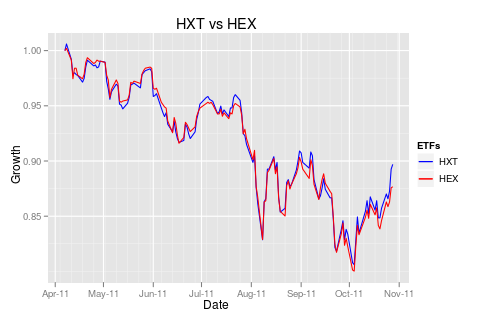
Today was that later point. I took Horizons HXT and HEX ETFs. There are more details on the web site, but in general, HXT is a TSX60 ETF with re-invested dividends, while HEX is the covered called version, paying dividends on monthly basis. HEX was introduced in April and I made my purchase a few months later. Before jumping to the results let’s try to state my expectations. I was expecting after dividends HEX to outperform HXT. Seriously, weren’t the last few months the “best” by definition environment for covered call ETFs?

Now, here is the performance chart:

HXT vs HEX

HXT vs HEX

This chart was created using the following code:

library( quantmod )
library( ggplot2 )

# Get the symbols
getSymbols( c("HXT.TO", "HEX.TO"), from="1900-01-01")

# Align the dates
mm = merge( Ad( HXT.TO ), Ad( HEX.TO ), all=F )

# Compute the returns
hxtRets = dailyReturn( mm[,1] )
hexRets = dailyReturn( mm[,2] )

# Compute the growth
hxtGrowth = cumprod( 1 + hxtRets )
hexGrowth = cumprod( 1 + hexRets )

# Build a data frame for ggplot
df = data.frame(
            time(hxtGrowth),
            hxtGrowth,
            hexGrowth,
            row.names=seq(1, length(time(hxtGrowth))))
colnames(df) = c("Date", "HXT", "HEX")

# Plot
gg = ggplot( df, aes( Date ) )
gg = gg + geom_line( aes( y=HXT, color="HXT" ) )
gg = gg + geom_line( aes( y=HEX, color="HEX" ) )
gg = gg + opts( title="HXT vs HEX" )
gg = gg + xlab( "Date" ) + ylab( "Growth" )
gg = gg + scale_color_manual( name="ETFs", values=c("HXT"="blue", "HEX"="red"))
gg

Let’s put it this way – I am disappointed by this chart. Not only the covered call ETF performed worse, it did so with the same level of volatility (just eyeballing the chart). There is even more to it – the above chart assumes perfect dividend re-investment. While there is DRIP in Canada, there are no fractional shares. It’s probably insignificant, but certainly something to keep in mind for products that yield 10-20% annually. Last but not least, HXT does not pay any dividends – they are reinvested and as of recently, its trading is free if your stock broker is Scotia iTrade.

The above chart is not the only tool I used for this analysis, I also maintain a spreadsheet to track the exact performance of these ETFs. Unfortunately, the results of my spreadsheet looks similar to my chart.

The moral of the story – if something looks too good be true, probably it is. The media hype is always a suspect, even from reliable sources like the venerable BNN.

Posted in R, Strategies | 4 Comments »

S&P 500 approaching the 200-day moving average

Posted by The Average Investor on Oct 27, 2011

With an agreement from Europe, backed by lots of money, tomorrow is likely to be a huge green day in the markets. In order to close above its 200-day moving average, the S&P 500 needs to close above $1,274.19, or +2.59%. Quite possible, if not tomorrow, certainly over the next few days (the breaking point is valid only for tomorrow, but it should be close to the right number anyways). From technical perspective, it starts to look more and more like we are done with the correction. Surprisingly, (tongue in chick) the fundamentals are pointing to the same conclusion.

Happy trading!

Posted in Market Timing, Strategies | 1 Comment »

A Dow Theory Buy Signal?

Posted by The Average Investor on Aug 30, 2011

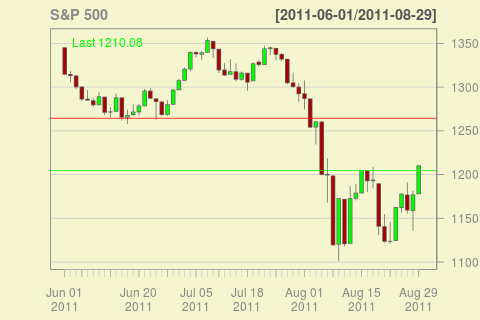
Looks like the markets finished a formation today, which could be interpreted as a buy signal, at least according to my interpretation of Schannep’s Dow Theory for the 21st century. As I mentioned in an earlier post both the S&P 500 and the Dow Jones Industrial were getting closer to the important levels. The big upswing today finished the formation for both indexes.

S&P 500

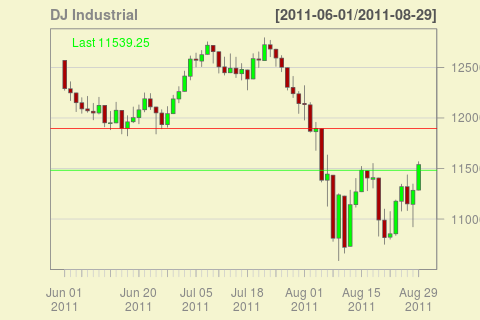
The chart for the Dow Jones Industrial is more or less the same:

Dow Jones Industrial

Dow Jones Industrial

The red line shows the level where the sell signal was generated, while the new green line shows where the buy is signaled. Not a significant difference, the entry is about 1% lower than the exit. For the full description of this trading indicator, refer to the newsletter on the above mentioned web site (there is also a book there). In practice, the entry would have been a lower, since the author has an elaborate system to enter in steps, trying to fore-run the classical Dow Theory, and this step-wise process would have worked nicely here.

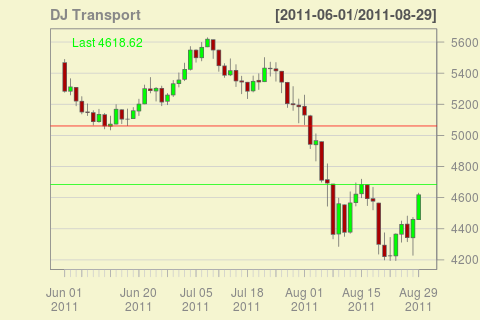
This is all assuming that the whole thing doesn’t turn sharply down and we indeed have reached an important bottom. Notice that there is no buy signal using the classical Dow Theory, which, by the way, doesn’t really have a quantitative description and is often interpreted differently by different acolytes, since the Dow Jones Transports haven’t confirmed the signal.

DJ Transport

Is it going to be another triumph for the new Dow Theory? Wait and see …

Posted in Market Timing, Strategies | Leave a Comment »

Important Developments

Posted by The Average Investor on Aug 25, 2011

A really important week for the markets ending with a statement from the Fed on Friday, which may spur some buy signals based on my interpretation of various indicators. This is no advice to purchase any shares of course, but let’s take a look at the crystal ball of actions. As always, the action alternatives are clear, the results are a mistery. 🙂

With respect to the 20-Week EMA, unless the markets explode, there will be no developments. Here is the data:

Index Price Cross Wednesday Close Percentage (Cross/Close)
S&P 500 $1,271.87 $1,177.60 8.00%
Nasdaq 100 $2,274.56 $2,145.04 6.00%
US REIT $58.40 $55.30 5.60%
Emerging Markets $45.64 $40.63 12.30%

The table tells us for instance, that the S&P 500 needs to close about 8% higher on Friday than the close on Wednesday in order for the close to be above its 20-week EMA.

There is every chance that we may get a buy signal with respect to the Dow Theory, as always, my guide is the Jack Schannep’s book in the link section. My interpretation is that currently the important levels are:

Index Recent Highes Wednesday Close Percentage (Highes/Close)
S&P 500 $1,204.49 $1,177.60 2.28%
DJ Industrials $11,482.90 $11,320.71 1.43%
DJ Transports $4,684.44 $4,428.43 5.78%

Quite close in fact, just keep in mind that two of the three indexes have to penetrate their recent highes.

Next, the 200-Daily EMA for the S&P 500 stands $1,260.44. Quite unlikely to be penetrated tomorrow, but certainly doable in a two/three day rally.

Finally, next Wednesday is the end of the month, thus, the re-calculation of the 10-month EMA. At the end of last month, the S&P 500 closed above this average. In order to close above it again, thus avoiding a sell signal, the S&P 500 needs to close next Wednesday above $1,278.64. Pretty ambitious in general, but quite possible in the current environment.

Happy trading!

Posted in Market Timing, Strategies, Trades | 1 Comment »

The Tame RUT (Russell 2000)

Posted by The Average Investor on Aug 24, 2011

The Crazy RUT post on R-bloggers caught my attention some time ago. The main point is that there is no dominant strategy for RUT (the Russell 2000, small-cap index) based on long-term moving averages. My recollections from me back-testing many moving averages on this index were similar. So, I got curious – would the Crazy RUT be too much for my ARMA strategy to handle?

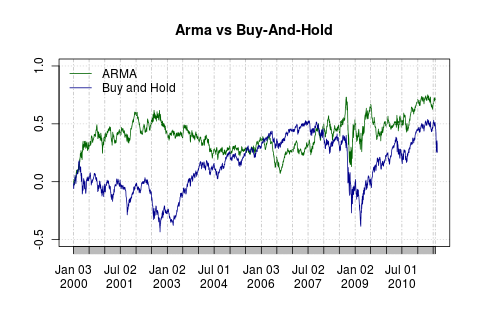
Russell 2000 ARMA vs Buy-And-Hold

Although impressive, it is obvious that most of the gains happened during the bull market of the 90s. The same chart for the period since 2000 confirms.

Russell 2000 ARMA vs Buy-And-Hold (2000 onwards)

Still outperforming buy and hold but by a much narrower margin. In fact, if we begin the comparison in 2002, it might be that buy and hold performed better. This is clear from the annual performance:

Year Buy-And-Hold ARMA
2011 -17% 1%
2010 25% 25%
2009 25% -3%
2008 -35% 1%
2007 -3% 23%
2006 17% -7%
2005 3% 5%
2004 17% -5%
2003 45% -6%
2002 -22% -16%
2001 1% 26%
2000 -4% 44%
1999 20% 21%
1998 -3% 61%
1997 21% 55%
1996 15% 26%
1995 26% 41%
1994 -3% 40%
1993 17% 50%
1992 16% 40%
1991 44% 82%
1990 -21% 54%

Posted in Strategies | Leave a Comment »

ARMA Models for Trading, Part VI

Posted by The Average Investor on Jul 6, 2011

All posts in this series were combined into a single, extended tutorial and posted on my new blog.

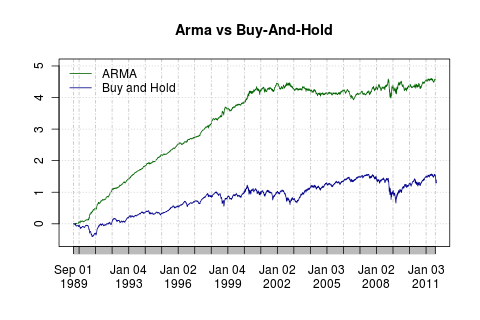
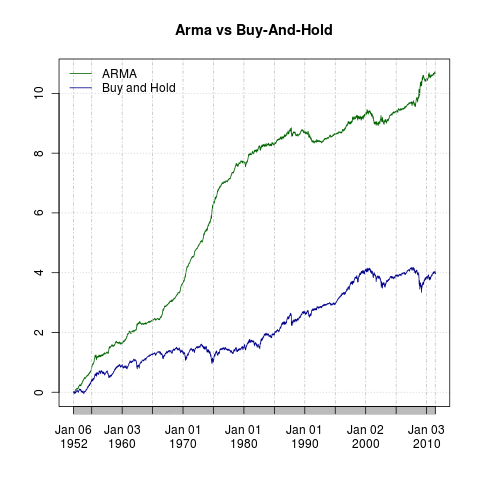
In the fourth posting in this series, we saw the performance comparison between the ARMA strategy and buy-and-hold over the last approximately 10 years. Over the last few weeks (it does take time, believe me) I back-tested the ARMA strategy over the full 60 years (since 1950) of S&P 500 historic data. Let’s take a look at the full results.

ARMA vs Buy-and-Hold

ARMA vs Buy-and-Hold

It looks quite good to me. In fact, it looks so impressive that I have been looking for bugs in the code since. 🙂 Even on a logarithmic chart the performance of this method is stunning. Moreover, the ARMA strategy achieves this performance with a maximum drawdown of only 41.18% vs 56.78% for the S&P 500. Computing the S&P 500 returns and drawdowns is simple:

library(quantmod)
library(timeSeries)

getSymbols("^GSPC", from="1900-01-01")
gspcRets = Ad(GSPC) / lag(Ad(GSPC)) - 1
gspcRets[as.character(head(index(Ad(GSPC)),1))] = 0
gspcBHGrowth = cumprod( 1 + gspcRets )
head(drawdownsStats(as.timeSeries(gspcRets)),10)

The above code will produce the 10 biggest drawdowns in the return series. To compute the ARMA strategy growth, we first need the daily indicator. This indicator is what took so long to compute. It is in Excel format (since WordPress doesn’t allow csv files). To use the file in R, save it as csv, without any quotes, and then import it in R via:

library(quantmod)
gspcArmaInd = as.xts( read.zoo(file="gspc.all.csv", format="%Y-%m-%d", header=T, sep=",") )

The first column is the date, the second the position for this day: 1 for long, -1 for short, 0 for none. Note, the position is already aligned with the day of the return (it is computed at the close of the previous day), in other words, no need to shift right via lag. The indicator needs to be multiplied with the S&P 500 daily returns, and then we can follow the above path. The next two columns are the number of auto regressive and the number of moving average coefficients for the model giving the best fit and used for the prediction. The GARCH components are always (1,1).

The only thing I didn’t like was the number of trades, a bit high for my taste – 6,346, or a trade every 2.35 days on average. This has the potential to eat most of the profits, more so in the past than today, however (lower transaction costs, higher liquidity). Still, taking into account the gains from this strategy together with the exceptional liquidity of S&P 500 instruments (SPY for instance trades about 167.7 million shares lately), should suffice to keep a significant amount of the profits.

Last, the simple R-code that produced this nice chart from the two growth vectors is worth showing:

png(width=480, height=480, filename="~/ttt/growth.png")
plot(log(gspcArmaGrowth), col="darkgreen", main="Arma vs Buy-And-Hold")
lines(log(gspcBHGrowth), col="darkblue")
legend(x="topleft", legend=c("ARMA", "Buy and Hold"), col=c("darkgreen", "darkblue"), lty=c(1,1), bty="n")
dev.off()

Pretty neat if you ask me! Code snippets like this one are what makes me believe command line interface is the most powerful interface.

Posted in Market Timing, R, Strategies | Tagged: , , , | 7 Comments »

The Weekly Update

Posted by The Average Investor on Jun 11, 2011

Stay out – that’s what all the 20-week EMA has been telling us over the last two weeks. Last week the US stock indexes caved in and at the end of this week the Emerging Markets and the US REIT gave a sell signal too.

The EEM position was short lived, yet another whipsaw, and resulted in a loss of -2.68%. The VNQ position on the other hand has been open for a while, since July 23, 2010, and have resulted in a 16.34% gain.

Markets seem to be getting in a grizzly mood as of late and it seems to be very hard to think of any positive event on the horizon. In my view we have been on a drinking binge since the beginning of 2009 orchestrated by the central banks. Now even the hardest participants are starting to give up and there is nothing, literally nothing left but a heavy, dark hangover.

Seriously though, what is there to show for all the money we destroyed by pouring them hopefully into the system? The housing in the US is officially in double dip, Greece is back in the same situation as a year ago. Shall we take pride in reducing the unemployment by a mere 1.4%? While that’s a significant number, was it worth the money? Japan, the third largest economy, is in a recession yet again largely as a result of the devastating quake, but also aided by the sick, debt-laden economy they have been running for a while now.

It does look ugly, not only from a technical perspective. The only bright spot in my mind is that despite of the six red weeks, the pullback has been relatively mild so far, less than 8% on the S&P 500. For comparison, in May 2010 the S&P 500 lost almost 16% in the matter of a few weeks. Let’s hope it turns out to be just that – a minor correction.

Posted in Market Timing, Strategies, Trades | Leave a Comment »

ARMA Models for Trading, Part V

Posted by The Average Investor on Jun 8, 2011

All posts in this series were combined into a single, extended tutorial and posted on my new blog.

Once back testing is done and the results of the trading system are convincingly positive, it’s time to move it to production. Now, how do we implement something like the ARMA techniques I described earlier in practice (assuming a retail brokerage account)?

In an earlier post I discussed the problems related to trading at the close and various solutions. Thus, in this post, I will discuss only the two obstacles I had to overcome for the ARMA methods.

My implementation was to compute a table of actions for each instrument I am interested in. Here is an example:

-0.99%, 1
-0.98%, 1
-0.97%, 1
-0.96%, 1
-0.95%, -1
-0.94%, -1
-0.93%, -1
-0.92%, -1
-0.91%, -1
-0.9%, -1

The above table tells me what position I am supposed to take at the close of the day for various changes (as a percentage) in the price. In the above example, anything up to and including -0.96% is a long position. In other words, if the instrument loses more than -0.96% – take long.

The first problem I found was the computational time. These computations are expensive! I had two choices – code everything in C or buy hardware. Obviously I went after the latter solution – no idea how long it would have taken to port everything successfully to C. For less than $900 I managed to assemble an i7 system which was running a few orders of magnitude faster than my laptop. Moreover it is able to run up to 8 workloads in parallel. If you are unfamiliar, i7 has four cores plus hyper-threading, which makes it sort of similar to an eight core machine and so far it has proved good enough to compute 4 to 5 maps in about 3 hours. All the computations are run in parallel as daily cron jobs in Linux. The results are sent to me in an email. 🙂 The scripts implementing the infrastructure are available on the quantscript project.

The bigger problem was that quite often the computations were not stable enough. In the above example there was a single switch between the long and the short position (at -0.95%). Thus, at 15:55, if the instrument is away from this point, one can take the position with confidence that it won’t cross the line in the last second. Of course, it’s not going to be perfectly on the close, but on average, you shouldn’t expect high negative impact from this type of slippage. Same holds if one is trading moving averages – there is a single prices that separates the long and short position and it can be even determined mathematically.

No such luck for my ARMA implementation, quite often the table of actions looks like:

0.75%, 1
0.76%, 1
0.77%, -1
0.78%, 1
0.79%, 1
0.8%, -1
0.81%, -1
0.82%, 1
0.83%, 1
0.84%, 1
0.85%, -1

If the price is within this range in the last few minutes, there is no guarantee whether it will stop on a long or on a short. So what to do? My solution was simply to not take a position if the price is within an unstable region nearby the close. The alternative is to take the position and be happy with it until at least the open on the next day. After the close we can compute the exact position and if we did the wrong thing, bought when we were supposed to sell, we can close the position at the next day open. Sometimes we will get lucky and it will move in the directions that benefits us regardless of what the system says.

This brings me to the last point – after the close is known, I compute the precise positions and check against the actual positions. If necessary I might take corrective actions during the next day.

My experience so far from a trading point of view is quite positive. What I described above is not too hard to follow in practice. I hope it proves worth the efforts. 😀

Posted in Market Timing, Strategies | Tagged: , , , | 8 Comments »