The Average Investor's Blog

A software developer view on the markets

Archive for August, 2011

A Dow Theory Buy Signal?

Posted by The Average Investor on Aug 30, 2011

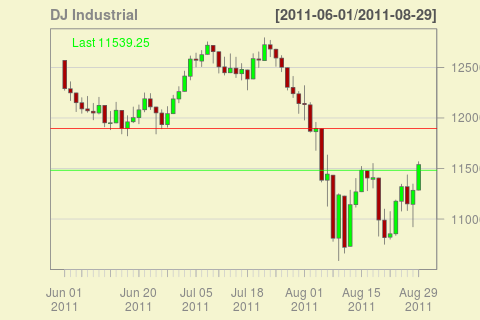
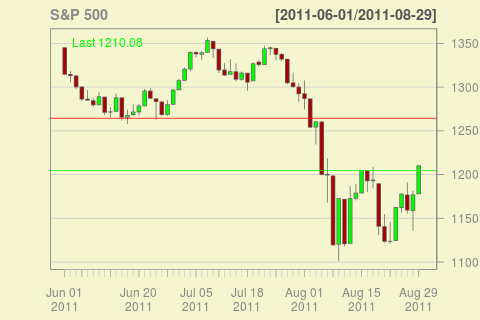
Looks like the markets finished a formation today, which could be interpreted as a buy signal, at least according to my interpretation of Schannep’s Dow Theory for the 21st century. As I mentioned in an earlier post both the S&P 500 and the Dow Jones Industrial were getting closer to the important levels. The big upswing today finished the formation for both indexes.

S&P 500

The chart for the Dow Jones Industrial is more or less the same:

Dow Jones Industrial

Dow Jones Industrial

The red line shows the level where the sell signal was generated, while the new green line shows where the buy is signaled. Not a significant difference, the entry is about 1% lower than the exit. For the full description of this trading indicator, refer to the newsletter on the above mentioned web site (there is also a book there). In practice, the entry would have been a lower, since the author has an elaborate system to enter in steps, trying to fore-run the classical Dow Theory, and this step-wise process would have worked nicely here.

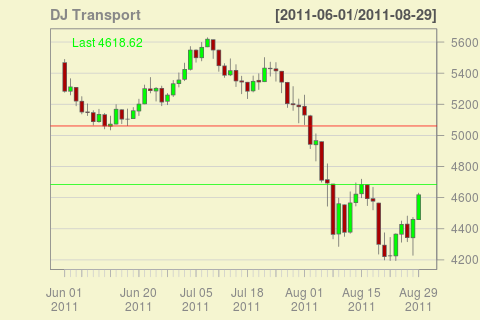
This is all assuming that the whole thing doesn’t turn sharply down and we indeed have reached an important bottom. Notice that there is no buy signal using the classical Dow Theory, which, by the way, doesn’t really have a quantitative description and is often interpreted differently by different acolytes, since the Dow Jones Transports haven’t confirmed the signal.

DJ Transport

Is it going to be another triumph for the new Dow Theory? Wait and see …
Posted in Market Timing, Strategies | Leave a Comment »

Important Developments

Posted by The Average Investor on Aug 25, 2011

A really important week for the markets ending with a statement from the Fed on Friday, which may spur some buy signals based on my interpretation of various indicators. This is no advice to purchase any shares of course, but let’s take a look at the crystal ball of actions. As always, the action alternatives are clear, the results are a mistery. 🙂

With respect to the 20-Week EMA, unless the markets explode, there will be no developments. Here is the data:

Index Price Cross Wednesday Close Percentage (Cross/Close)
S&P 500 $1,271.87 $1,177.60 8.00%
Nasdaq 100 $2,274.56 $2,145.04 6.00%
US REIT $58.40 $55.30 5.60%
Emerging Markets $45.64 $40.63 12.30%

The table tells us for instance, that the S&P 500 needs to close about 8% higher on Friday than the close on Wednesday in order for the close to be above its 20-week EMA.

There is every chance that we may get a buy signal with respect to the Dow Theory, as always, my guide is the Jack Schannep’s book in the link section. My interpretation is that currently the important levels are:

Index Recent Highes Wednesday Close Percentage (Highes/Close)
S&P 500 $1,204.49 $1,177.60 2.28%
DJ Industrials $11,482.90 $11,320.71 1.43%
DJ Transports $4,684.44 $4,428.43 5.78%

Quite close in fact, just keep in mind that two of the three indexes have to penetrate their recent highes.

Next, the 200-Daily EMA for the S&P 500 stands $1,260.44. Quite unlikely to be penetrated tomorrow, but certainly doable in a two/three day rally.

Finally, next Wednesday is the end of the month, thus, the re-calculation of the 10-month EMA. At the end of last month, the S&P 500 closed above this average. In order to close above it again, thus avoiding a sell signal, the S&P 500 needs to close next Wednesday above $1,278.64. Pretty ambitious in general, but quite possible in the current environment.

Happy trading!

Posted in Market Timing, Strategies, Trades | 1 Comment »

The Tame RUT (Russell 2000)

Posted by The Average Investor on Aug 24, 2011

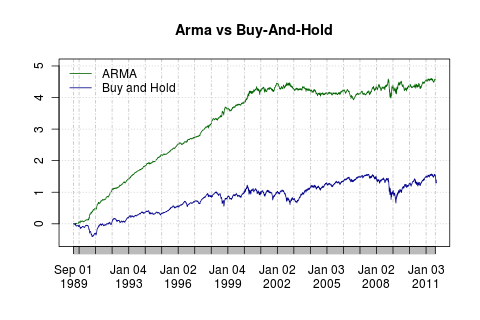
The Crazy RUT post on R-bloggers caught my attention some time ago. The main point is that there is no dominant strategy for RUT (the Russell 2000, small-cap index) based on long-term moving averages. My recollections from me back-testing many moving averages on this index were similar. So, I got curious – would the Crazy RUT be too much for my ARMA strategy to handle?

Russell 2000 ARMA vs Buy-And-Hold

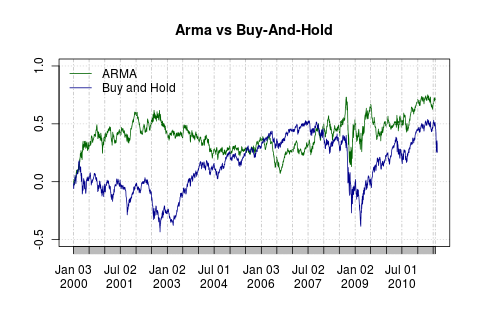
Although impressive, it is obvious that most of the gains happened during the bull market of the 90s. The same chart for the period since 2000 confirms.

Russell 2000 ARMA vs Buy-And-Hold (2000 onwards)

Still outperforming buy and hold but by a much narrower margin. In fact, if we begin the comparison in 2002, it might be that buy and hold performed better. This is clear from the annual performance:

Year Buy-And-Hold ARMA
2011 -17% 1%
2010 25% 25%
2009 25% -3%
2008 -35% 1%
2007 -3% 23%
2006 17% -7%
2005 3% 5%
2004 17% -5%
2003 45% -6%
2002 -22% -16%
2001 1% 26%
2000 -4% 44%
1999 20% 21%
1998 -3% 61%
1997 21% 55%
1996 15% 26%
1995 26% 41%
1994 -3% 40%
1993 17% 50%
1992 16% 40%
1991 44% 82%
1990 -21% 54%

Posted in Strategies | Leave a Comment »

The Weekly Update

Posted by The Average Investor on Aug 21, 2011

Not much new developments in markets, just more of the same – the relentless free fall continues.

Index Weekly Loss
S&P 500 -4.69%
Nasdaq 100 -6.59%
Dow Jones Industrial -4.01%

The slump on Thursday and Friday ate all recent gains, but the lows from the week before were not broken.

S&P 500

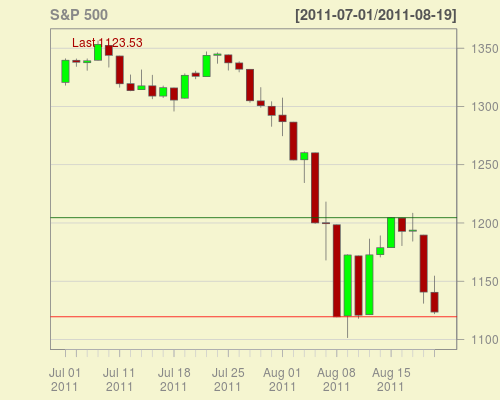
Could it be that this bear market is bottoming? According to Dow Theory for the 21st Century, once the definition of a bear market is reached (-16% both on the S&P 500 and the Dow Jones Industrial average), the S&P 500 falls another 12% on average. The S&P 500 peak for 2011 was $1,363.61, thus, a 16% correction leads us to $1,145.43, about 20 points higher than where we are today. Another 12% from this level will leave us with an average bottom of $1,007.89.

Notice the two horizontal lines. They signify the important levels with respect to the Dow Theory. Breaking the red line (at the close), at the recent lows of $1,119.46, will confirm the bear direction, while penetrating the green line will trigger a buy signal. Of course, all these need to be with some agreement with one of the other two indexes (Dow Jones Industrial or Dow Jones Transports).

Last, the ARMA indicator losses on the S&P 500 now stand at -7.50% for the year, compared to -10.64% for the index. The indicator was short Monday and Tuesday, but long for the rest of the week. The position for Monday is long. 🙂

Happy Trading!

Posted in Market Timing, Trades | Leave a Comment »

The Weekly Update

Posted by The Average Investor on Aug 14, 2011

This bear market is developing rather rapidly. Last week we saw a few events of importance, which usually take longer time to develop. First the market downturn reached a bear market definition – 16% drop both on the S&P 500 and on the Dow Jones. This is the definition I use, which I saw first in Jack Schannep’s excellent book Dow Theory for the 21st Century. By the way, this is one of the few books written about technical analysis which presents a method that actually works.;)

The event happened on Wednesday, with the Dow Jones joining the S&P 500 by reaching a 16% decline from the recent highs and thus, a bear market was in place. Two days earlier however the markets went into extremely oversold territory which is typically consistent with a bear market bottoms (the above mentioned book is my guide in this area as well). On the same day, Monday, August the 8th, it seemed to me that we finished a Dow Theory sell signal.

Earlier, on August the 2nd, the S&P 500 penetrated its 200-day moving average and, around the same time, the 20-week moving average. The last man standing is the 10-month moving average, but only because it’s computed at the end of the month (if we do the math today, the S&P 500 has penetrated that average as well).

All in all, we are in a bear market territory, but based on the liquidation sell off we saw last week, the most pain might be behind us and the lows might be already in place. Only the future will tell however whether Tuesday’s extremely oversold conditions were a genuine buy (true most of the time) or one of the few panic liquidations on the way down (what happened in 2008).

The situation is extremely ugly – four years later, we are about 25% below the peak in 2007. Inflation adjusted, the picture is even grimmer – we are bellow the peak in 2000! Even after this stellar performance, we have the same people at the crucial positions running the same rotten policies, so it may take a while longer (I know it will at some point) for the natural animal spirits to take over and cleanup this mess.

The ARMA indicator didn’t fare much better. It was long all the way until recently, turning short on Friday which was a positive day. Currently it stands at -0.58% for the year, still better than the -6.27% for the S&P 500 (excluding dividends). And if you wonder, the indicated ARMA position for Monday is short again.

Happy trading!

Posted in Market Timing, Trades | Leave a Comment »

When the Music Stops …

Posted by The Average Investor on Aug 9, 2011

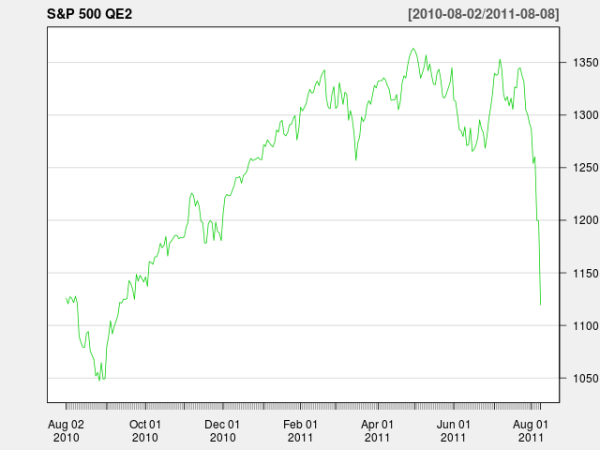
About a year ago, quantitative easing 2 (QE2) was all over the news. The ever-fighting deflation, almighty Federal Reserve flexed its muscles and promised a dump worth of $600 billion to inflate asset prices. And asset prices did get inflated, including stock markets, reaching a new top in the bull run that started in March 2009.

S&P 500 during QE2

Then the music stopped. Reality took over. The S&P 500 went back again where it was before QE2 and the free fall momentum seems to be getting only stronger. Unemployment went up again. Housing market dipped again. The US lost its AAA rating. But that’s just another $600 billion righteously-spent based on the ideology set by Mr. Keynes. Still far away from what’s necessary according to prominent economists. Many of them saying in recent interviews that the economy needs more stimulus in the (ever-lasting) short term, and some of them agreeing that, of course, medium to long-term a cleaning of the deficits is needed. Of course, they didn’t mention when the short-term ends (a minor detail, since it seems to me that this short term goes back at least to 2008, probably to 2002 and likely even before). Huh?!

Can’t help but wonder: If we ask an average person on the street what would have he expected the economic situation to be after 15 years of reckless spending, debt accumulation and money printing, how often the answer will be closer to the mess we are in than to the prosperity naturally following Keynesian interventions (links needed;)?

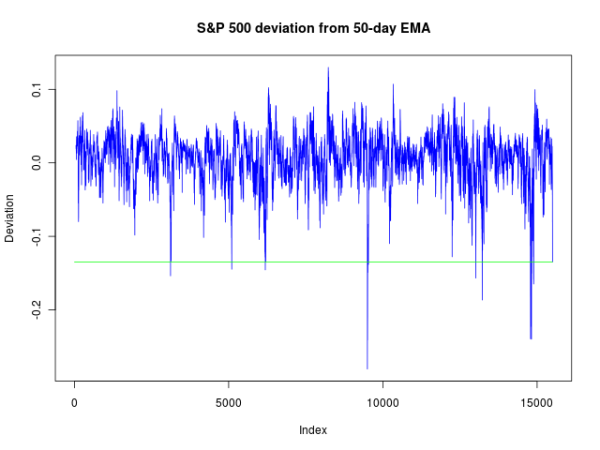
Back in the real world, the S&P 500 is extremely oversold by any metric. I took the difference between the S&P 500 and its 50-day EMA:

linrary( quantmod )
getSymbols( "^GSPC", from="1900-01-01" )

dd = round( coredata( Ad( GSPC ) ) / EMA( coredata( Ad( GSPC ) ), 50 ) - 1, 4 )
ecdf( dd )( last( dd ) )

aa = dd[ !is.na( dd ) ]
length( aa[ aa < last( aa ) ]

plot(dd, type="l", col="blue", main="S&P 500 deviation from 50-day EMA", ylab="Deviation")
ll = rep(last(dd), length(dd))
lines(ll, col="green")

The ecdf statement gives us the percentile – 0.3624361. Ouch. The last three lines produce an easy to understand chart:

S&P 500 Deviation from 50-day EMA

While the S&P 500 has been in more oversold state on 55 other occasions (the length line in the above code) in its 61 year history, 30 of them were in the 2007/2009 crisis, and there are only 6 other distinctive events in time. Ouch.

A typical liquidation panic seems to be under way, more often associated with bear market bottoms. Ouch.

Unfortunately, when the music stops … the reality settles in.

Posted in Uncategorized | Leave a Comment »

The Weekly Update

Posted by The Average Investor on Aug 7, 2011

A dark-red week for all markets. The worst weeks since the financial crisis of 2007-2009.

All indexes are below their 20-week MA as of Friday (the S&P 500 and the Emerging Markets closed below their 20-week MA the week before). From my understanding of the Dow Theory, based on Schannep’s interpretation, we also had a sell signal triggered at Tuesday’s close. The S&P 500 also pierced decisively below its 200-day MA. All in all a screaming “out-of-the-market” situation.

Only the long-term monthly moving averages (10-month for instance) haven’t yet indicated a sell, but that’s only due to the fact that the position is re-evaluated only at the end of each month. The S&P 500 closed July slightly above its 10-month MA, thus maintaining the long position, and dipped below it on the first day of August. Interesting to see whether this long-term MA will save us from a whipsaw or is going to trigger a delayed, and more painful, sell.

With all the problems in Europe, and especially with the US downgrade, it is hard to concoct any near-term trigger for a bullish sentiment, but markets are full of surprises. In any case, it looks like a vicious bear is on the lose, at least for the time being.

The ARMA strategy was long for the entire week and it suffered the same fate as the S&P 500. At 2.23% for 2011 it’s still in the green for the year, but that can easily be reversed on Monday, which is likely to be a down day and the indicated position is still long. The ARMA strategy is contrarian to a degree and has problems understanding a series of severe down days.

Posted in Market Timing, Trades | Leave a Comment »

Summarizing Returns with R

Posted by The Average Investor on Aug 2, 2011

Often I like to see the performance of a trading strategy summarized annually, quarterly or by month. In R, we start off with the summary function:

aggregateReturns = function( xx, leverage=1 )
{
   return( tail( cumprod( 1 + xx*leverage ), 1 ) )
}

Given a series xx, usually a chunk of the original, this function returns the accumulative returns for the period. The leverage is useful to somewhat simulate leveraged ETFs.

The rest is to call this function for various periods:

summarizeDailyReturns = function(
      ss,
      indicator,
      returns="closeToClose",
      period="annually",
      leverage=1 )
{
   stopifnot( length( index( ss ) ) == length( index( indicator ) ) )
   stopifnot( is.xts( ss ) )
   stopifnot( is.xts( indicator ) )

   if( tolower( returns ) == "opentoclose" )
   {
      stopifnot( has.Op( ss ) && has.Cl( ss ) )
      rets = Cl( ss ) / Op( ss ) - 1
   }
   else 
   {
      stopifnot( has.Ad( ss ) || has.Cl( ss ) )
      if( has.Ad( ss ) )
      {    
         rets = Ad( ss ) / lag( Ad( ss ) ) - 1
      }    
      else 
      {    
         rets = Cl( ss ) / lag( Cl( ss ) ) - 1
      }    
   }

   rets[as.character(head( index( ss ), 1 ))] = 0
   rets = as.xts( indicator * coredata( rets ) )

   if( tolower( period ) == "annually" )
   {
      yy = as.numeric( format( index( rets ), "%Y" ) )
      rets = aggregate( rets, yy, aggregateReturns, leverage )
   }
   else if( tolower( period ) == "quarterly" )
   {
      rets = aggregate( rets, as.yearqtr, aggregateReturns, leverage )
   }
   else if( tolower( period ) == "monthly" )
   {
      rets = aggregate( rets, as.yearmon, aggregateReturns, leverage )
   }

   return( round( rets, 4 ) )
}

I will finish the post with an illustration how to use this function (assuming the two functions reside in returns.R from the current directory):

library(quantmod)

source("returns.R")

getSymbols("^GSPC", from="1900-01-01")

# The indicator - buy and hold: 1 every day
ind = xts(rep(1, length(index(GSPC))), order.by=index(GSPC))

summarizeDailyReturns(GSPC, ind, returns="OpenToClose")
summarizeDailyReturns(GSPC, ind, leverage=2, period="quarterly")
summarizeDailyReturns(GSPC, ind, leverage=2, period="daily")

The last call computes the compound growth on a daily basis. 🙂

The final version of the function is available from the quntscript project.

Posted in R | Leave a Comment »

The Weekly Update

Posted by The Average Investor on Aug 1, 2011

The free fall in the world stock markets continues, currently with no break in sight. Bad news are taken as bad, while good news are overshadowed by anything negative, it starts to look like a bear market change in the mood.

A few of the indexes I monitor closed last week, which was brutal by the way, below their 20-week MA. Two are still above, but all gains are gone:

Asset Symbol Position Date In Gain
US REIT VNQ Long 2011-07-01 -0.14%
Nasdaq 100 ^NDX Long 2011-07-01 0.06%

The S&P 500 closed the month of July again above its 10-month MA, a situation established at the end of September 2010.

The ARMA strategy is still outperforming the market, mostly because it is taking short positions once in a while too, and mostly being “right” with the big moves. It is up by more than 10% for the year with the S&P 500 up only 1.6% for the same period of time.

Posted in Market Timing, Trades | Leave a Comment »