RSI(2) and the pre 80s Market
Posted by The Average Investor on Feb 17, 2011
In his detailed research on RSI(2) indicator, MarketSci emphasized several times that the contrarian strategies based on the RSI(2) indicator didn’t start working until the 80s. I remembered this observation recently when I observed another interesting anomaly …
In statistics, an important initial step in studying time series data is to consider the auto correlation of the series. In R, the simplest way to accomplish this is to use the acf function (for more details see Introductory Time Series with R). The R code to visualize the auto correlations is:
library(quantmod)

getSymbols("^GSPC", from="1900-01-01")

acf(diff(Cl(GSPC["2009"])), na.action=na.pass, main="S&P 500 - Correlation between Lags in 2009")
The result looks exactly “as expected”. There is no statistically significant correlation (the dotted lines) at any of the lags.
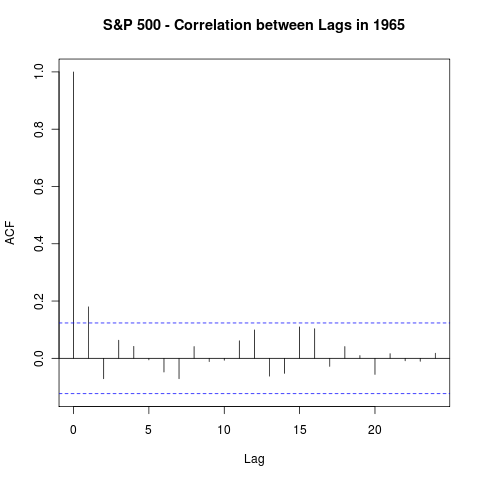
Imagine my surprise when I run the same command for the 1965:
Now there is a statistically significant correlation at lag 1! At this point I remembered MarketSci statement and decided to dig further. To make the long story short, for the most of the 60s and 70s, this correlation existed. I can hear some of you saying so what?
Here is what, a strong correlation in lag 1 means that the returns of the previous day are very predictable of the returns of the next day. In other words, I would expect a very simple strategy as take a long position at the close if market is up or take a short position at the close if the market is down, to perform quite well. This is like taking a heavily biased bet with the odds on the better’s side! Using some R code I quickly tested it and lo and behold, it seemed to work quite well! The detailed results would have to wait a next posting though …


Investing with the Odds « The Average Investor's Blog said
[…] this previous post, I showed that a look at the correlations in the daily returns of S&P 500 should have lead to a […]
T said
But what happens when you take slippage into account? 99.9% of simple strategies turn negative once you do,
The Average Investor said
Trading the SPY on the close can have non-random and significant slippage only if you are moving millions. I am not, and it does seems to work for me very well in practice. I discussed this approach on my new blog. http://www.quintuitive.com/2013/04/07/on-close-trading-with-loc-moc-orders/ is a good place to start.